

Guide to Ebook Trading and PDF Resources
Discover how to trade ebook PDFs safely with tips on legal aspects, popular platforms, and best practices. Stay secure & manage your digital library efficiently 📚🔒
Edited By
James Carter
Chart patterns play a significant role in technical analysis, helping traders and investors predict potential price movements. These patterns form on price charts and reveal market psychology—whether optimism, fear, or indecision among participants. Recognising and interpreting these patterns accurately can give a trader an edge.
There are several key types of chart patterns: continuation patterns that hint at a trend lasting longer, and reversal patterns signalling a possible change in trend direction. Triangles, head and shoulders, double tops, and flags are common examples. Each of these shapes carries distinct implications about market behaviour.
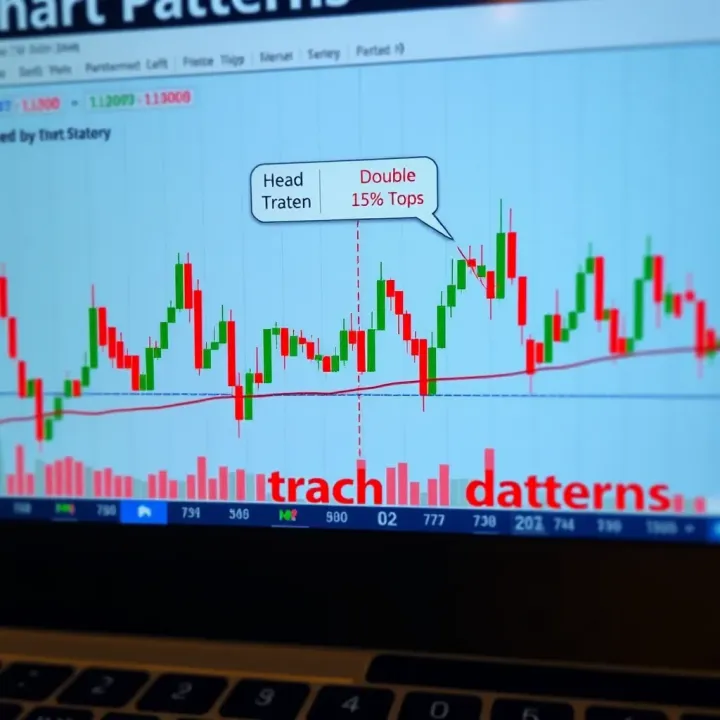
For instance, a head and shoulders pattern may indicate an upcoming bearish reversal after an uptrend, while a flag suggests the market is taking a pause before continuing the same trend. Paying attention to volume during these formations deepens understanding, since rising volumes often confirm the pattern's credibility.
Understanding chart patterns is not just about spotting shapes but reading what the market participants might be planning.
Experienced traders turn to books dedicated to chart patterns to enhance their learning. These books offer detailed explanations, examples, and historical contexts to solidify pattern recognition skills. Accessing such resources in PDF format provides convenience, especially for professionals juggling busy schedules.
When looking for chart pattern books in PDF, prioritise reputable authors with proven expertise in technical analysis. Books by authors like Thomas Bulkowski or Martin Pring provide practical insights grounded in data, not just theory. Also, ensure downloads come from legitimate sources to avoid copyright issues and malware risks.
In India’s dynamic market environment, combining chart pattern knowledge from reliable PDF books with local market awareness—like understanding effects of policy changes or festive season trends—can improve trading strategies markedly.
In summary, mastering chart patterns requires both observational skill and good resources. Chart pattern books in PDF format are valuable tools for traders wanting to refine their approach and make smarter investing choices.
Chart patterns offer traders and investors a snapshot of market sentiment by visually representing the battle between buyers and sellers. Understanding these patterns helps decode the collective psychology behind price movements, which is essential for making informed trading decisions. For instance, a head and shoulders pattern often signals a potential trend reversal, hinting at a shift in buyer-seller dynamics before it formally plays out in the price.
By recognising such patterns, traders can anticipate market moves rather than react late, providing an edge. This is particularly handy in volatile markets like Indian equities or commodities, where spotting a reliable pattern early can mean the difference between profits and losses.
Connection between price movement and trader psychology
Price movements reflect how traders collectively perceive value and risk at different moments. When prices form certain shapes, these chart patterns mirror the underlying emotions—fear, greed, indecision—that drive those market participants. For example, during a double top formation, repeated failed attempts to break a high indicate growing seller confidence, suggesting a possible downward shift ahead.
Understanding this psychological aspect lets traders align their strategy with market sentiment, increasing the chance that their trades resonate with actual market behaviour. It’s like reading the crowd’s mood before deciding your own move.
Common signals generated by chart patterns
Chart patterns serve as signals that point to potential future price directions or pauses in trends. They typically indicate:
Trend continuation: Patterns like flags or pennants show that a current trend is likely to persist.
Trend reversal: Patterns such as head and shoulders or double bottoms suggest a potential change in direction.
Recognising these signals early means you can position your trades accordingly. For instance, if an ascending triangle forms during an uptrend on the Nifty, it often signals a steady push higher once the pattern breaks.
Predicting price direction and trend reversals
Chart patterns help anticipate where prices might head next—whether continuing along their current path or reversing altogether. This foresight enables traders to enter or exit positions with better timing. For example, spotting a cup and handle pattern in a stock like Reliance Industries may signal a bullish breakout, prompting timely buying decisions.
Investors use these predictions to adjust their portfolios before major shifts, helping preserve gains or avoid losses. While not foolproof, chart patterns provide clues derived from collective market behaviour that often precede price moves.
Supporting risk management decisions
Chart patterns are also tools for managing risk. By defining entry points, exit targets, and stop-loss levels around the pattern’s structure, traders can limit potential losses. For example, after recognising a double bottom reversal, a trader might place a stop-loss just below the pattern’s support level, safeguarding their capital if the market moves unexpectedly.
Moreover, these patterns help in sizing positions according to the expected price move, making trades more systematic and less driven by emotion. This disciplined approach is especially crucial in fast-moving Indian markets with sharp swings.
Understanding chart patterns combines technical skill with psychological insight, making it an indispensable part of effective trading and investing.
By focusing on these practical benefits and clear signals, traders and investors can use chart patterns not just as theoretical concepts but as active tools to sharpen their market strategies.

Recognising popular chart patterns helps traders make informed decisions by anticipating potential price moves. These patterns reveal the market psychology behind price changes, allowing you to predict where prices might head next. Understanding specific patterns and their traits can improve your trading strategy, reduce risks, and identify entry or exit points.
Head and Shoulders is a classic reversal pattern signalling a trend change from bullish to bearish, or vice versa in its inverted form. It consists of three peaks, with the middle (head) higher than the two shoulders. Traders often see this as a warning that the existing trend is losing momentum. For example, if the Sensex forms a Head and Shoulders top after a strong rally, it might indicate a pending downturn. Confirming this with volume declines during the pattern’s formation adds weight to the signal.
Double Top and Double Bottom patterns indicate trend reversal as well but are simpler to spot. A Double Top forms when prices hit a resistance level twice, failing to break upwards, signalling potential downward move. Conversely, a Double Bottom happens when prices bounce off a support level twice, hinting at an uptrend ahead. If Nifty repeatedly tests 17,000 and fails to rise higher twice, that’s a Double Top. These patterns suggest traders should tighten stop-losses or prepare for reversal trades.
Triangles (Ascending, Descending, and Symmetrical) show periods of consolidation before price continues the previous trend. An Ascending Triangle has a flat resistance and rising support, signalling a possible upward break. A Descending Triangle features a flat support and falling resistance, hinting at a downward move. Symmetrical Triangles have converging trendlines, with breakout direction uncertain until movement occurs. For instance, an Ascending Triangle in an uptrend on a stock like Reliance Industries might mean buyers are gearing for a fresh push upwards.
Flags and Pennants are short-term continuation patterns that appear after sharp price swings (flagpole). Flags look like small rectangles slanting against the trend, while Pennants are small symmetrical triangles. Both signal brief pauses before the trend resumes. Traders watch for volume drops during the pattern and strong volume breakout as confirmation to enter fresh positions or add to existing ones, especially in volatile stocks.
Cup and Handle resembles a tea cup followed by a small pullback (handle). After the cup forms a rounded bottom, the handle shows minor consolidation. Once price breaks above the handle, it often results in a strong rally. This pattern suggests healthy accumulation and is popular with longer-term investors seeking sustained gains. For example, a mid-cap IT company forming this pattern on monthly charts might attract buying interest.
Rounding Bottom is a slow reversal pattern where prices gradually shift from downtrend to uptrend, forming a smooth "U" shape. This pattern reflects a change in sentiment from pessimism to optimism. It’s common in stocks recovering from extended declines, signalling a steady uptrend ahead. Traders must be patient here, confirming breakout with volume and price action before committing.
Recognising these popular chart patterns equips traders to anticipate market moves and manage risks better. Combining them with other indicators improves reliability.
By mastering these common patterns, you lay a solid foundation for technical analysis and can navigate markets with more confidence and timing precision.
Accessing reliable chart patterns books in PDF format helps traders and investors deepen their understanding of technical analysis without needing to carry physical copies. PDFs are convenient, searchable, and often cost-effective, making them ideal for learning on-the-go. More importantly, trusted sources ensure the material is accurate and in line with current market practices, which is essential because outdated or incorrect information can lead to poor trading decisions.
Books by Established Technical Analysts
Books authored by well-known technical analysts often carry insights developed through years of market experience. For instance, works by Thomas Bulkowski or John J. Murphy are regarded globally as benchmarks in chart pattern analysis. These authors explain not only what patterns look like but also how to interpret the nuances of volume, breakout points, and the psychological factors behind price movements. Learning from such authoritative sources equips traders with tested strategies rather than just textbook theory.
Print and Digital Versions Availability
Most popular chart pattern books are available both in print and digital formats. PDFs provide easy access, especially for those consistently trading or analysing charts from mobiles or laptops. Printed copies, however, remain valuable for readers who prefer physical notes and highlight markings. Many Indian traders combine both methods, reading PDFs during market hours and annotating printed books during non-trading times to reinforce learning.
Official Publisher Websites
Purchasing chart pattern books directly from the publisher's website guarantees authentic and latest editions. Publishers such as Wiley or McGraw-Hill provide PDFs with supplementary content like interactive charts or updates. Buying from these sources also supports the authors and creators, encouraging more quality content in the future.
Trusted Indian E-book Platforms
Several Indian online stores like Amazon India, Flipkart, and other e-book platforms offer digital versions of popular technical analysis books. These platforms often provide regional pricing and support payment via UPI, net banking, or wallets, making legal access affordable and convenient for Indian readers. Their user reviews can further help gauge a book's value before purchase.
Avoiding Piracy and Unsafe Downloads
Downloading pirated PDFs may seem tempting to save money but poses serious risks like malware infections and legal troubles. Unofficial sources often distribute low-quality or incomplete versions, potentially misleading readers. Instead, stick to verified platforms and official publishers. Many times, free legitimate resources such as sample chapters or public domain materials are available for those unwilling to invest immediately.
Reliable chart pattern books are the backbone of effective technical analysis — secure, up-to-date, and well-explained content can make a real difference in trading success.
By focusing on trusted books and legitimate sources, you ensure your knowledge stays sharp and relevant, helping you navigate markets more confidently and profitably.
Using chart patterns books effectively can significantly improve your trading outcomes. These books don’t just list patterns; they explain how price action reflects market sentiment and how you can read those signals accurately. A focused approach to study will help you apply the concepts practically rather than just theoretically.
Step-by-step interpretation is crucial in making sense of what chart patterns show. Most good books break down the pattern formation process, starting from identifying the setup to recognising the breakout. For example, when studying a Head and Shoulders pattern, the book would guide you to spot the left shoulder, head, and right shoulder in sequence, then watch volume changes during the breakout. This structured approach helps you see the pattern's evolution and decide the right entry and exit points.
Practical examples also include charts from different markets and timeframes, which is useful since not all patterns look textbook-perfect. By following these real examples, you learn to adjust for market noise and subtle variations.
Common pitfalls to avoid include mistaking random price swings for reliable patterns or entering trades too early before confirmation. Many new traders jump the gun when a pattern seems to form but hasn’t fully matured. Books often warn about ignoring volume confirmation or neglecting the overall trend, which are typical errors. For instance, spotting a Double Top in a strong uptrend may not be reliable unless other signals support a reversal.
Another pitfall is over-relying on patterns without considering external factors like major news or economic data which can disrupt technical signals.
Confirming patterns with volume and other indicators strengthens your trading decisions. Volume often acts as a validation tool—a rising volume during a breakout confirms genuine momentum. For example, if a Cup and Handle pattern breaks out with high volume, it indicates buyer interest is real, and the trend is likely to continue. Books suggest pairing patterns with indicators like Relative Strength Index (RSI) or Moving Averages to detect overbought or oversold conditions, thus refining entry points.
Setting stop-loss and target prices based on the pattern’s structure allows effective risk management. Most charts provide clear levels where the pattern becomes invalid. For example, in a Head and Shoulders pattern, placing a stop-loss just above the right shoulder can limit losses. Target prices are often estimated by measuring the height of the pattern and projecting it from the breakout point. Chart patterns books teach such methods, helping you avoid guesswork and keep emotions out of trading decisions.
Applying knowledge from chart patterns books with these practical steps turns charts from mere drawings into actionable strategies. This keeps your trades systematic and disciplined, essential qualities for lasting success in trading.
Downloading chart patterns books in PDF format can be very convenient for traders and analysts, but it comes with safety and legal issues you shouldn’t overlook. Neglecting these concerns could put your device at risk, lead to data loss, or even cause you to unintentionally break copyright laws. This section explains the main risks and ethical considerations, helping you avoid trouble.
One of the biggest dangers when downloading free or cheap chart pattern resources is malware hidden in the file. Malicious software can infect your computer, lead to data corruption, or allow hackers to steal sensitive information. For example, a trader downloading PDFs from unknown sites might unknowingly download a Trojan or ransomware that locks their files until a ransom is paid. Such attacks are especially risky if you use the same device for managing trading accounts or banking apps.
Phishing links disguised as legitimate download sources are common too. These can trick users into sharing login details or personal information. Always cross-check the source before clicking any download button, and prefer official or well-known e-book platforms to reduce this risk.
Besides malware, some suspicious websites collect personal data during or after download without clear consent. They might track your activity, obtain your email or phone number, and later send spam or targeted ads. If you are using your trading device for multiple purposes, exposure to such trackers can lead to data breaches or identity theft.
To protect your privacy, use trusted sources and maintain up-to-date antivirus programs. Avoid entering unnecessary personal details when signing up for downloads, and use secure internet connections rather than free public Wi-Fi.
Authors and technical analysts invest significant effort in researching and writing chart patterns books. Downloading pirated PDFs not only hurts these creators financially but also undermines the publishing ecosystem. Using unauthorised copies could result in legal action in India, especially with stricter enforcement from bodies like the Copyright Office.
Respecting copyrights encourages more high-quality content and ensures that traders get accurate, up-to-date information. It also prevents you from unknowingly sharing or trading illegal copies, which can harm your reputation.
Thankfully, you can find plenty of legal, free resources for learning chart patterns. Some authors or institutions offer sample chapters or full books under open licences. Also, platforms like the National Digital Library of India provide authorised e-books, which are safe and legal to use.
Using these official channels supports authors and the industry, while safeguarding you from legal and security issues. When choosing PDFs, look for verified publishers or government-backed repositories to ensure you are accessing credible and lawful content.
Remember, taking care of safety and legal aspects when downloading chart patterns PDFs keeps your trading journey smooth, secure, and credible.
Discover how to trade ebook PDFs safely with tips on legal aspects, popular platforms, and best practices. Stay secure & manage your digital library efficiently 📚🔒

Master seven essential chart patterns 📈 for trading success. Learn how to spot trends, make smarter moves, and get a free PDF guide for quick reference.

Explore Rifa FX in forex trading 💹: key concepts, tools, strategies, risk management, and challenges to help Indian traders make smarter decisions.

📊 Master range markets in India with this guide! Learn to spot patterns, use technical tools, manage risks, and trade smartly within stable price bands.
Based on 9 reviews