
Understanding Quotex Withdrawal Times for Indian Traders
Learn how long Quotex withdrawals take and what affects the timing ⏳. Get tips for fast payouts and explore payment options 📱💸 for Indian traders.
Edited By
James Harrington
When trading Bitcoin in India, understanding the daily candle close time is key to making informed decisions. The daily candle, a concept from technical analysis, summarises price movements within a 24-hour period. Bitcoin’s daily candle closes once the current day ends, but since crypto markets run 24/7, knowing the exact close time in Indian Standard Time (IST) is essential.
Typically, Bitcoin’s daily candle closes at midnight UTC (Coordinated Universal Time). Since IST is UTC +5:30, this means the daily candle for Bitcoin closes at 5:30 am IST the next day. For example, the daily candle closing at 00:00 UTC on 10 March will be 5:30 am IST on 10 March.

For Indian traders, this timing matters because many trading platforms and charting tools follow UTC-based candle timings. Tracking when the candle closes helps in reading charts accurately and planning entries or exits accordingly.
Knowing the candle close time affects strategy in various ways:
Trend confirmation: Traders use daily candle closes to confirm price trends before making moves.
Volatility assessment: The moments around candle close often see increased volatility, offering opportunities but also risks.
Technical indicator signals: Many indicators reset or update based on candle closes, influencing buy/sell signals.
To monitor Bitcoin price movement effectively, Indian traders should:
Set their charting tools to reflect IST or be mindful of the 5:30 am offset.
Watch price action in the early morning hours to catch key signals from the candle close.
Combine daily candle analysis with other timeframes to avoid false signals.
Understanding the daily candle close time is not just a technical detail; it helps you read the market pulse more clearly. This awareness sharpens decision-making and can provide an edge in the fast-moving world of cryptocurrency trading in India.
The daily candle close in cryptocurrency trading marks the final price point at the end of a 24-hour trading period on a candlestick chart. This value is critical because it reflects the market sentiment for that day, helping traders understand whether buyers or sellers dominated. For instance, if Bitcoin's price closes higher than it opened, it indicates bullish sentiment for the day, while a lower close suggests bearishness.
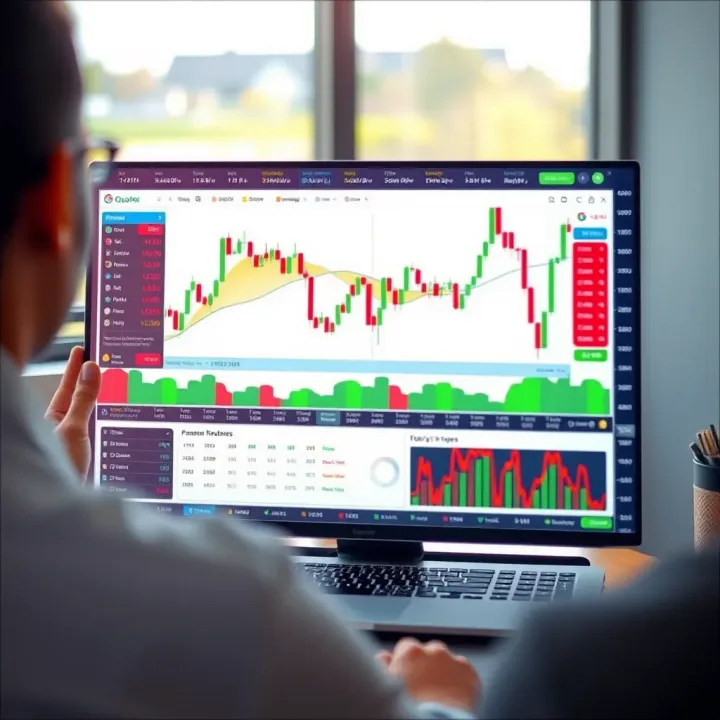
Candlestick charts are the preferred tool for traders as they visually capture price movements within specific timeframes. Each candlestick shows four key pieces of data: the opening price, the highest price, the lowest price, and the closing price for the period it represents.
Understanding candlestick components: A single candlestick comprises a body and wicks (or shadows). The body spans from the opening price to the closing price, showing whether the price went up or down. Wicks extend beyond the body to the highest and lowest points reached during that period. This visual helps traders quickly grasp price volatility and market behaviour within the timeframe.
For example, a tall upper wick may signal that sellers pushed back on price rises, while a long lower wick implies buyers stepped in to prevent further drops. Hence, candlestick components give nuanced insights beyond simply knowing the price itself.
How daily candles differ from other timeframes: Daily candles summarise price action over a full day, smoothing out short bursts of volatility seen in smaller intervals like 15-minute or hourly charts. This makes the daily close especially meaningful for assessing broader market trends rather than moment-to-moment noise.
Lower timeframe candles offer detailed views but can mislead traders into reacting to temporary spikes. In contrast, daily candles provide a stable reference point for setting stop-loss levels or confirming trend reversals.
How the close price determines daily market sentiment: The closing price is often seen as the most significant because it reflects the last consensus price after all buying and selling during the day. Traders consider it more reliable for gauging market strength compared to highs or lows that might be brief spikes.
For example, if Bitcoin closes near its daily low, traders may expect bearish momentum to continue. Conversely, a close near the high suggests strong demand and possible continuation of upward movement.
The daily candle close acts like the final scorecard, telling us how the market felt about Bitcoin during that round of trading.
Use of daily candle close in trend identification: Daily closes help identify key support and resistance levels, along with confirming trends. Multiple days of higher closes build confidence in a bullish run, while consecutive lower closes may signal a downtrend.
Traders use patterns formed by daily candles — like engulfing patterns or dojis — around the close price to make decisions. These patterns often forecast potential reversals or continuations better than intraday data alone.
In practical terms, an Indian trader watching Bitcoin daily candles would check the close time to plan entry or exit points precisely, balancing volatility with clearer signals given by daily closes rather than chasing smaller timeframe fluctuations.
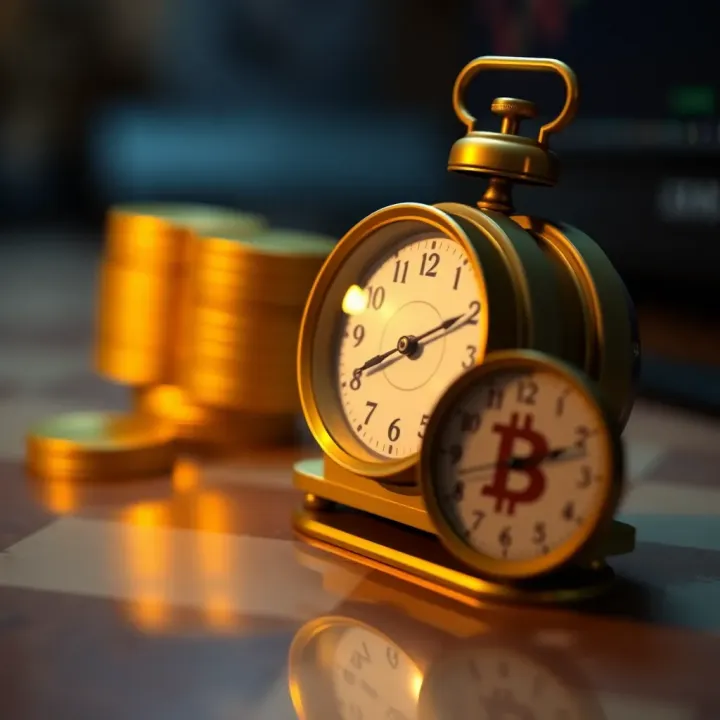
Understanding how Bitcoin's daily candle close time fits with Indian Standard Time (IST) helps traders in India make timely decisions. Since the global Bitcoin market operates 24/7, its daily price updates follow a certain standard time cycle, usually in Coordinated Universal Time (UTC). Aligning this with IST means Indian traders know exactly when a day ends on their charts and can better plan entries and exits to match global market movements.
Bitcoin trading happens across multiple exchanges worldwide, all following the UTC-based 24-hour cycle. This means each daily candle represents price activity from 00:00 to 23:59 UTC. This consistency allows traders globally to have a common benchmark for daily price moves regardless of where they are based.
Most platforms set their daily candles based on this UTC timeline, which keeps the charts uniform. When you check the daily charts on popular exchanges like Binance or Coinbase, the candle closes at the same exact time based on UTC. This standardisation helps avoid confusion since the Bitcoin market doesn't close like traditional stock exchanges, which often have local closing hours.
India operates on Indian Standard Time, which is UTC plus 5 hours 30 minutes. This offset means there is a fixed time difference to consider when comparing Bitcoin’s daily candle close on universal platforms to the local Indian market clock.
To be exact, since the Bitcoin daily candle closes at 23:59 UTC, it corresponds to 5:29 am IST the next day. For example, the daily candle that ends at 23:59 UTC on 10 March will technically close at 5:29 am IST on 11 March. This timing impacts how Indian traders read charts and plan their trades, especially if they use candle closes to confirm trends or signals.
Knowing that Bitcoin's daily candle closes early morning in India itself enables traders to prepare for fresh trading sessions with clear market sentiment from the previous day.
By keeping this time conversion in mind, Indian traders can sync their strategies better and avoid misreading daily charts that are anchored to the UTC clock rather than local time. This clarity especially benefits those using automated systems or price alerts tied to daily candle close times.
For Indian traders, understanding precisely when Bitcoin’s daily candle closes is vital. This timing directly influences how traders interpret market moves and execute their strategies within the Indian Standard Time (IST) zone. Since global Bitcoin exchanges usually define the daily candle close in Coordinated Universal Time (UTC), aligning this with IST ensures traders make timely, informed decisions relevant to their trading day.
The daily candle close serves as a reference point for deciding when to enter or exit trades. For example, if a trader in Mumbai sees Bitcoin’s daily candle closing strongly above a crucial resistance level at 5:30 am IST (which corresponds to midnight UTC), they might plan to enter a long position soon after. Missing this timing could mean entering too early or too late, risking unnecessary losses.
Since the cryptocurrency market runs 24/7, establishing this daily reset helps Indian traders align their strategies with global price action and avoid confusion. Practically, this means you can prepare for market movements around this time, reducing emotional decisions caused by price fluctuations at odd hours.
Daily candle closes often confirm technical signals like breakouts or reversals. Indian traders rely on these closes because intra-day price swings can be misleading. For example, if a daily candle closes below a key moving average, it more reliably confirms a bearish trend than price dips during the day.
By waiting for the daily candle close — at the fixed IST time equivalent — traders reduce false signals and base their moves on confirmed market behaviour. This disciplined approach can improve trading accuracy and prevent rash decisions driven by premature assumptions.
Volatility tends to spike near the daily candle close as institutional investors and large traders finalize their positions. In India, this translates to increased price swings and trading volumes around the 5:30 am IST mark. Being aware of this can help traders anticipate sudden moves and plan accordingly.
For instance, if you notice unusually high volume near candle close but without a clear price trend, it might be wise to wait for the candle to close before committing to a trade. This practice helps avoid getting caught in volatile noise.
Liquidity can thin out just before the daily candle closes, especially on smaller or less popular exchanges. This can cause slippage — when buy or sell orders execute at worse prices than expected. Indian traders might face higher slippage risks around the candle close.
To manage this, many traders monitor liquidity levels and avoid placing large orders right before the daily close. Instead, executing trades slightly before or after this period can reduce slippage and ensure better price stability.
Knowing the exact daily candle close time in IST helps Indian traders make smarter decisions by aligning with global market rhythms, confirming key signals, and managing risks associated with volatility and liquidity.
In sum, mastering the timing around Bitcoin’s daily candle close equips Indian traders with sharper tools to handle price action confidently and effectively.
Keeping an eye on Bitcoin’s daily candle close is vital for traders looking to make informed decisions in the Indian market. Since the daily candle close marks the end of one complete trading day, understanding its timing helps in assessing the true market sentiment. This section offers practical advice on monitoring candle closings effectively, ensuring you stay updated with minimal effort and maximum precision.
Not all trading platforms in India display daily candle timings clearly. Popular choices like WazirX, CoinDCX, and ZebPay provide straightforward charts with clearly marked candle close times, typically aligned with UTC. These platforms allow Indian traders to adjust timings or instantly translate markets to Indian Standard Time (IST), making it easier to interpret price movements relevant to local hours.
When selecting charting tools, prioritise platforms that support multiple timeframes and allow customisation of candle intervals. Features such as zooming on specific dates, overlaying volume data, and comparing indicators help you analyse trends more effectively. For instance, TradingView is widely used by Indian traders for its flexibility and clear visualisation of daily candle closes that align with international standards.
Price alerts set around the daily candle close are invaluable for catching important market moves without constant monitoring. You can configure alerts on platforms like CoinSwitch Kuber or Bitbns to notify you 15-30 minutes before the daily close, giving you time to prepare for trades or lock in profits based on your strategy.
Automated trading systems (bots) are increasingly common among Indian traders. These systems rely heavily on precise candle close timings to execute orders accurately. Misaligning these timings can result in missed opportunities or unintended trades. Therefore, make sure your automation tools or scripts are synchronised with the UTC daily close (which translates to 5:30 am IST) to execute trades at the right moments.
Monitoring Bitcoin’s daily candle close carefully can prevent costly mistakes and sharpen your entry or exit timing, especially in a volatile market like cryptocurrency.
By choosing platforms with clear candle timings and using alerts plus automation wisely, Indian traders can stay ahead without staying glued to screens all day. This practical approach balances real-time monitoring with convenience, helping you execute trade decisions confidently and on time.
Bitcoin trading involves watching candlestick charts closely, but traders often get tripped up by how daily candle close times differ across exchanges and timezones. Clearing up these confusions is key for Indian traders, especially when planning entry or exit points based on candle closes.
Not all cryptocurrency exchanges use the same daily time cycle for their candlestick charts. While many global platforms base their daily close on Coordinated Universal Time (UTC) at 00:00 hours, others might set it differently according to their internal policies or local conventions. For example, Binance and Coinbase generally use UTC midnight to mark the daily candle close, but some smaller or regionally focused exchanges may close their daily candle at a different hour.
This difference can cause real confusion if you compare charts from two exchanges without adjusting for their close times. Imagine you are tracking Bitcoin’s price on both an Indian platform and an international exchange. If the Indian platform shows the daily candle closing at 5:30 am IST (which corresponds to 00:00 UTC), but another exchange’s daily close happens several hours later, the candle patterns might appear mismatched. Traders relying only on one source may miss signals or misread trends.
To avoid this, always identify the candle close time your platform uses and cross-check it with other exchanges before making trading decisions. Checking the exchange’s documentation or support pages can confirm their daily close timing. This step helps ensure you interpret candlestick data accurately regardless of which exchange you use.
India uses Indian Standard Time (IST) throughout the year and does not observe daylight saving time (DST). This means the UTC offset remains fixed at +5:30 hours, making time conversion straightforward compared to countries that adjust clocks seasonally. Indian traders do not need to worry about changes in candle close timing due to DST shifts.
That said, since most Bitcoin candle closes are based on UTC, traders in India must consistently add 5.5 hours to convert UTC candle close times to IST. Because this offset never changes, you can set your alerts or automated trades with confidence that the timing stays stable year-round. This reliability helps in planning your trading day precisely around Bitcoin’s daily candle closes.
Remember, the absence of daylight saving time in India simplifies the process but only if you confirm your exchange sticks to UTC-based daily closes.
Ensuring accurate time conversion is especially important when you use tools or charting platforms that might default to local timezones. Double-checking the timezone settings of your trading software prevents mistakes in candle interpretation. For example, if your platform auto-converts candle times but assumes a different local time, your candle close alerts may trigger too early or late.
By understanding these timezone details and the lack of daylight saving in India, you can avoid common pitfalls and trade Bitcoin’s daily candles with greater accuracy and confidence.
Learn how long Quotex withdrawals take and what affects the timing ⏳. Get tips for fast payouts and explore payment options 📱💸 for Indian traders.
💹 Explore Qutex trading with our detailed guide! Learn its features, strategies, risks, and tips for investors in India to trade wisely and securely.
📊 Discover Quotex trading hours in India! Learn how Indian time zones align, factors affecting schedules, and tips to optimize your trading sessions effortlessly.
Is Quotex legal in India? 🇮🇳 Learn about the rules, user risks ⚠️, and how to navigate this trading platform safely under Indian law 📊.
Based on 8 reviews